


Ofsted & School Performance
Ofsted
Our latest Ofsted inspection was published on 18 June 2024. The ungraded inspection found our school to remain ‘Good’ in all areas, however Ofsted's positive findings suggest that we could have been judged "Outstanding" had this been a graded inspection. See the full report on the Ofsted website.
As a parent, you are able to offer Ofsted your view on our school via the Parent View link.
Early Years Foundation Stage
55% of pupils in Reception attained a Good Level of Development against the Early Years Framework. A Good Level of Development is defined as children working at the expected standard or exceeding the expected standard in the key areas of communication and language, physical development, personal, social and emotional development, literacy and mathematics.
Last year's national average for a Good Level of Development was 67.7%. Our most recent outcomes were below the national average. This is due to the unique makeup of the analysed cohort, which included a higher proportion of pupils with additional needs than is typical. While this may have affected overall data, it does not reflect on the high-quality teaching and strong progress made by pupils across the school.
Year 1 Phonics Screening
78% of pupils in Year 1 attained the expected standard in the Phonics Screening test. This is in line with the national average of 80%.
It is important to note that a number of new children joined our Year 1 class during the academic year (in-year transfers), and therefore didn't have the benefit of a consistent, on-year long, education. Out of the pupils that were with us since reception, 88% achieved the expected standard in the Phonics Screening Check.
Year 6: SATs results 2025
|
Subject(s) |
Kilburn Grange School |
National Average |
Average Scaled Score |
|---|---|---|---|
|
Reading, Writing, Maths combined - Expected Standard |
63% |
62% |
- |
|
Reading, Writing, Maths combined - Greater Depth |
12% |
8% |
- |
|
Reading - Expected Standard |
78% |
75% |
107 |
|
Writing - Expected Standard |
66% |
72% |
- |
|
Maths - Expected Standard |
73% |
74% |
105 |
|
Reading - Greater Depth |
37% |
33% |
- |
|
Writing - Greater Depth |
22% |
13% |
- |
|
Maths - Greater Depth |
24% |
26% |
- |
|
Science |
85% |
82% |
- |
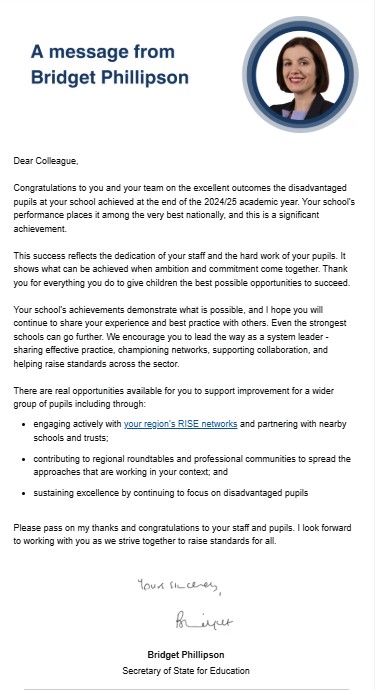
Congratulations from the Secretary of State for Education
In January 2026 we received a letter of congratulations from Bridget Phillipson, Secretary of State for Education, recognising our exceptional outcomes for disadvantaged pupils in the 2024/25 academic year. Read more about this here.
Government Performance tables
You can see our school performance tables here; these are updated when new information is available. They show the attainment of our pupils against the national average.